Integrating Heatmap Analytics into Your Website Audit Process

Heatmapping software like Crazy Egg and Hotjar make it easier to find patterns in user activity that might indicate problems with your website or areas for improvement.
Heatmapping is a useful tool in any marketer’s tool belt — as it can help you identify what’s hot (and what’s not) on your website.
Specifically, heatmapping tools provide a visual representation of user engagement and activity. By analyzing user data in the aggregate, you can gain new perspectives into which aspects of your website are performing as intended and which parts may not be hitting the mark with your target audience.
In this article, I’ll discuss the different types of heatmaps you should consider during your website audit process, and what each type of heatmapping can tell you about user activity and intent. I’ll also explain how heatmapping can fit into the broader contexts of a strategic website audit.
What are the different kinds of heatmap analytics?
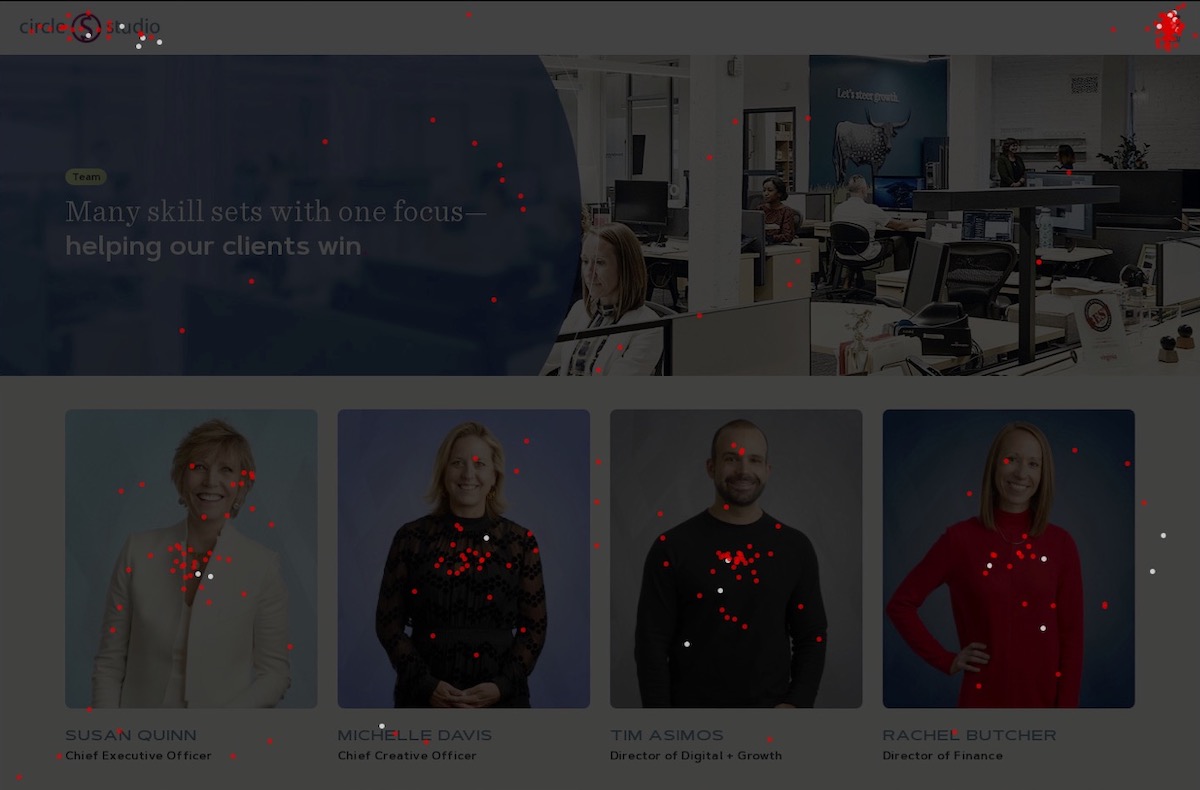
Click data shows that returning users (in red) tend to visit our Team page at a higher rate, and have a keen interest in viewing the profiles of our leadership team.
Marketers will frequently turn to heatmapping solutions as supplementary analytics tools that can be paired with more thorough data collection options like Google Analytics to provide better insights into user activity.
While there are numerous heatmapping solutions on the market (Crazy Egg, Hotjar, Mouseflow, Lucky Orange, and VWO heatmaps are some notable options), most center on collecting data around four key areas of user activity:
- Scrolls — How far a user scrolls down a page will often reflect how much of your content they’re actually reading or viewing. While Google Analytics collects similar data via the “scroll” event (which tracks scrolls past the 90% threshold), many heatmapping solutions take it a step further and show which sections of your page users are most likely to stop on. A “cold” section, then, would be one where the user didn’t scroll far enough to view it, or scrolled right past it without stopping.
- Clicks — Users will click on things that interest them. Whether that’s a link in your navigation menu, a play button for a video, or a toggle on an accordion, knowing which elements capture the user’s attention is key to increasing engagement and driving conversions. Click activity is also helpful for identifying dead clicks (clicks on elements that don’t do anything) and rage clicks (repeated clicks on one element that indicate user frustration).
- Mouse Activity (Vision) — Studies have shown that mouse tracking can be used to infer both user attention and the effectiveness of information flow patterns on web pages. For this reason, many heatmapping solutions track where users hover their mice as a way of correlating mouse activity with the specific elements that users are focusing on. In doing so, you can identify the effectiveness of different web elements (like videos, images, or links) in non-linear layouts that may not be captured by scrollmapping.
- Session Recordings — Sometimes, you just can’t beat the value of watching real-world interactions with your website. Most modern heatmapping services offer some form of session recording where user activity is tracked or recorded in a way that lets you play back the session and see exactly what the user did on your site. Often, this strategy is helpful for identifying system- or browser-specific bugs and understanding organic user activity relating to intent (does the user seem confused at where to go or what to do).
Taken together, these four key areas can supplement the macro event and session data collected by programs such as Google Analytics to provide new perspectives into how users interact with different elements of your site.
How can heatmap analytics help me perform a website audit?

Heatmap data from our homepage shows strong interest in the navigation buttons on our testimonial flex module. Additionally, we know that 44% of home page visitors in the testing period viewed this section.
Marketers usually initiate or request website audits with two goals in mind. First, to understand how users are currently using the website. Second, to identify potential areas for improvement for a future redesign or refresh initiative.
While manual reviews of the website and data from sources such as Google Analytics can be helpful in achieving these goals, having deeper access to real-world user sessions in the aggregate as a heatmap can help you spot patterns in user activity from a data-driven perspective.
While you may have a feeling that users find different elements of your website helpful, heatmapping gives you the data to back up your assumptions with facts about real-world user activity. This can help you make more powerful statements about your website that you can then use to make informed decisions about your next steps.
For example, imagine if you could go to the decision-makers in your organization with the following data:
- 44% of users stop scrolling to view the benefits section on our careers page.
- 87% of clicks on our careers page happen on the “View Open Positions” CTA at the top.
- Click data and real-world session recordings of activity on our website shows that the design of the carousel on our careers page is confusing to users, leading to lower than expected activity on this element.
The granularity of these hypothetical datapoints can help you start the conversation on specific, tactical ways you can improve engagement and drive user activity.
Further, the inherently visual nature of heatmapping makes it easier for non-technical team members to understand user activity without having to comb through spreadsheets, Google Analytics reports, or other more data-oriented versions of the information.
View your website from a different perspective
Different audiences will interact with your website in different ways. Predicting and accounting for these different use cases is essential to improving the user experience and driving engagement.
The best way of accounting for different usage patterns is to audit your site so you can gain an understanding of how users are currently interacting with your content.
While data from services such as Google Analytics can be helpful, it also only provides a single perspective of this issue of user engagement.
Leveraging other perspectives — such as a manual review from a designer or SEO specialist and a thorough heatmap analysis of your core pages — is thus essential to gaining a comprehensive understanding in your audit of how users engage with and navigate around your site.
"*" indicates required fields
By signing up you are agreeing to our Privacy Policy.