What Makes a High-Performing AEC Website? AEC Website Benchmarks and Best Practices for 2025

Website performance shouldn’t be a guessing game, yet most AEC firms still lack the benchmarks they need to compete, convert, and grow online. In this article, we break down the latest website performance data, KPIs, and best practices—so you can see how your site stacks up and identify areas for improvement.
With the sunset of Universal Analytics in July 2024, many marketers have been left without a clear frame of reference when it comes to evaluating their website’s performance and how it stacks up against competitors. Benchmarking, once a key feature in Universal Analytics, played an important role in putting website KPIs into context. As of today, Google Analytics 4 (GA4) has yet to release any form of comprehensive benchmarking report, making it difficult to gauge how your KPIs compare to industry standards.
In this article, we’ll explore three key benchmarks for AEC websites you can use to inform your marketing and website improvement efforts: engagement rate, average engagement time, and the ratio of new to returning visitors. The goal of these benchmarks is to help you measure what matters and serve as a guide your ongoing website and marketing optimizations.
NOTE: All data collected for this article was sourced using GA4 data for the month of January 2025 from a sample of 20 client websites with a minimum monthly active user base of at least 1,500 visitors.
Why Does Website Engagement Matter for AEC Firms?
In the AEC industry, where buying cycles are long and relationships are built on trust, your firm’s digital presence plays a critical role in how prospects evaluate and ultimately choose a partner. Unlike quick B2C transactions, AEC decisions often involve multiple stakeholders, extended research periods, and high-value investments—making your website a central touchpoint throughout the journey.
Engagement metrics reveal real interest. When a potential client is exploring your services, their behavior on your website—such as time spent on service pages, case studies, or blog content—provides a window into their level of interest and where they are in the decision-making process. A highly engaged visitor is more likely to convert into a qualified lead.
Content performance matters. Whether it’s a detailed project case study, a thought leadership article, or a service overview, all content on your site helps educate and communicate with potential clients. Tracking engagement helps you understand what’s resonating and what needs refining.
Trust and reputation are everything. AEC firms are hired based on proven expertise, reliability, and the ability to deliver. Your website is often the first impression a prospect gets—it’s where they assess your past work, team capabilities, and industry knowledge. A strong digital experience that reflects your brand and builds credibility can make the difference between a missed opportunity and a new client.
Ultimately, a high-performing website is a lead generation engine. The more effectively it engages visitors, the more likely it is to convert them into long-term partners.
For information on how to set up GA4 engagement tracking, refer to Google’s documentation on the topic.
What are the Average GA4 Engagement Rate Benchmarks AEC Firms Need to Know?

Average engagement rate box and whisker chart for a sampling of high-performing AEC websites.
Engagement rate is defined as “the percentage of engaged sessions on your website or mobile app [when compared to the total number of sessions on your site].” An engaged session is a session that lasts longer than 10 seconds, has a conversion event, or has at least two page views or screen views.
In other words, engagement rate helps you measure the percentage of visitors to your website that perform some kind of relevant and valuable action, such as reading your content or clicking a link. This makes engagement rate a vital KPI in gauging your site’s ability to quickly connect with visitors and satisfy user intent.
Engagement Rate Benchmarks for 2025
Using data collected from our clients, we found that a healthy engagement rate for most AEC and professional service firms sits around 45%-55%, depending on a variety of factors such as industry, monthly active users, and the ratio between organic and paid traffic.
As a few points of reference to compare this range against:
- Out of the 20 AEC client websites we surveyed, the average engagement rate was 51.41% while the median engagement rate was 51.86%. Note: the proportion of direct and paid traffic tends to skew engagement rates slightly for sites with a lower amount of organic search traffic.
- Data from Databox’s Benchmark Groups indicates that the median engagement rate across all industries for the month of September 2024 was 56.21%, while Professional Service firms tended toward a lower median of 52.97%.
Taken together, these numbers hint at an average engagement rate target of somewhere in the realm of the lower to mid 50s, with sites that place a greater emphasis on engagement rates breaking into the low 60s.
Since we’re still in the early days of GA4, it’s important to note that none of these numbers are definitive.
Engagement rates can vary widely by industry, and even more so by traffic source. For instance, organic search and email campaigns often see higher engagement, while PPC and direct traffic typically generate lower rates.
Notably, the median engagement rate has declined since we last analyzed these benchmarks in October of 2023 when the average hovered around 55%-60%. This shift underscores how engagement can fluctuate over time based on factors like website and content updates, as well as technical issues.
As such, while industry benchmarks can be helpful, your most meaningful insights will come from tracking and comparing your own site’s engagement trends over time.
What High-Performing AEC Websites Have in Common
High-performing AEC websites start from the shared foundation of having clear UX and UI. They are designed to guide visitors effectively through the website with an eye toward what will be most intuitive and direct the user to the information they need as quickly as possible. Visitors should be able to quickly understand your firm, what you do, and how to get in touch.
Beyond navigation through the website, there are other factors top AEC websites have in common. One of those is the right content—optimized and delivered quickly to those who visit your website.
Content that Engages and Answers User Questions
In an industry where reputation and expertise are everything, your past work is often your best sales tool. High-performing sites make it easy to explore case studies and featured projects, with visuals, context, and measurable results that build trust and demonstrate impact.
But having the right content doesn’t mean anything if your prospects can’t find it. That’s where a smart SEO strategy will support your efforts. Top-performing websites will include optimized page titles, meta descriptions, and content that connects to the keywords your audience is actively searching for.
An Optimized Experience Across Devices
Today’s users expect fast-loading pages and seamless mobile experiences. Leading AEC websites prioritize performance and make sure their content is accessible across devices.
Strong CTAs that Convert
The best sites will ultimately turn visitors into opportunities. Prominent, well-placed calls to action (CTAs) and streamlined lead capture forms make it easy for potential clients to take the next step, whether that’s downloading a brochure, requesting a consultation, or getting in touch. With that piece complete, it’s important to then have the right workflows in place to nurture opportunities that come your way.
How to Increase User Engagement on your Firm’s Website
Engagement rate is calculated as the total number of engaged sessions a site receives divided by the total number of sessions. For this reason, the best way to improve your site’s engagement rate is to simply find ways to make your site more “engaging.”
For this specific discussion, this means either (1) finding a way to make a greater percentage of sessions last longer than 10 seconds, (2) adding tracking tags for key conversions on core pages (such as if someone lands directly on a team member’s page from organic search and immediately clicks on their phone number), or (3) providing more compelling UX signals to users so they are more likely to navigate to a second page or another location on your website.
Using these three ideas as a guideline, we can identify a few ways to improve a site’s conversion rate through small, iterative improvements:
- Provide high-quality, relevant content. Users want to spend time with content that is both rich in value and intimately relevant to their interests or needs.
- Prioritize page speed and overall site design. Websites that load quickly will often perform better than ones that don’t. Further, foregrounding an attractive and compelling design is an effective way of grabbing and holding the interest of your users, making them stay longer on your site.
- Position your firm as a subject matter expert. Take steps to position your firm and your team as experts in your field through supplementary content such as case studies, white papers, and videos.
- Perform a detailed website audit. The most effective way to quickly gauge where you should spend your efforts is to perform a detailed website audit with the goal of identifying areas for improvement and the strategies you’ll need to get there.
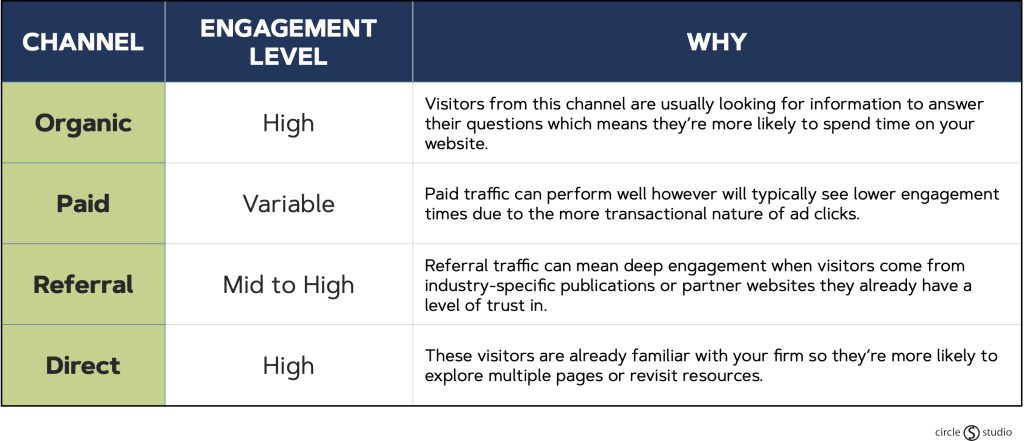
Which Traffic Channels Drive the Best Engagement for AEC Firms?
Understanding how different traffic channels perform in terms of engagement is critical for AEC firms looking to build brand authority, attract qualified leads, and nurture long-term relationships. While traffic quantity matters, engagement is where quality reveals itself—and where leads are most likely to convert.
How Long Should a User Spend on an AEC Website?
In Google Analytics 4, the “average engagement time” metric measures how long users interact with your website during a single session.
Specifically, average engagement time is measured by dividing the total amount of time users spent with your web page in focus by the total number of active users that visited your site in a given time period.
For example, if a user (1) clicks on a link to your site, (2) looks at your home page for one second, then (3) clicks on a different tab and doesn’t come back to the site, GA4 will measure the “engagement time” of this session as only one second, since the page was only in the foreground for that first second.
Meanwhile, if a user spends five minutes actively scrolling through an article on your site, that average engagement time will reflect how long they were engaging with your content. This differs from average session time, which also includes periods where your website was open in a background tab—even without active engagement.
Average Engagement Time Benchmark for AEC Firms
In reviewing our clients’ sites, we found that the average engagement time was equal to around 44 seconds (with a median of 40 seconds). The datapoints spread varied widely, reaching as high as 2:01 minutes. Contributing factors depend on the client and the amount of content they had on their highest-trafficked pages.
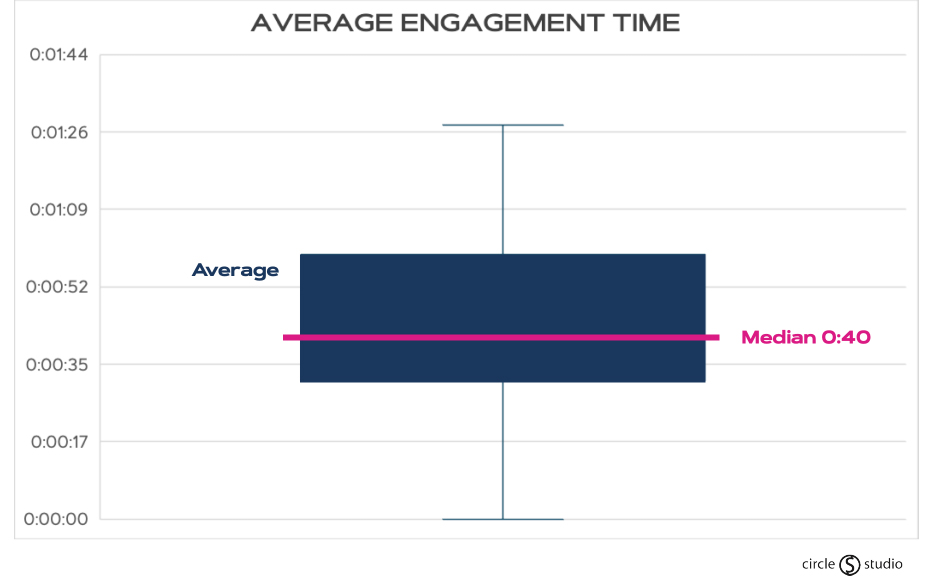
Average engagement time box and whisker chart for a sampling of high-performing AEC clients.
This number varies from what was previously reported when we analyzed the numbers in 2023 where we found that the average engagement time was equal to around 60 seconds (with a median of 63 seconds). Since then, we’ve seen redefined engagement metrics and technical issues, such as linking GA4 properties, causing discrepancies and decreases in engagement time after migrating to GA4.
Note, your performance in this metric will largely depend on the types of content that users are looking for on your site. After all, some users may want to spend ten minutes reading a detailed blog post, while others may want to just get an email or contact information as fast as possible.
There isn’t much information available regarding engagement time benchmarks to compare this number against. However, when it comes to engagement time for high-performing AEC websites, it’s all about finding the baseline and target that work best for your individual site.
Tracking Engagement Time in GA4
Because average engagement time is a measure of how long users directly interact with your site, it’s a good metric to gauge how effective core pages are at engaging members of your audience and convincing them to interact deeply with your content.
Historically, the target in Universal Analytics for “average session duration” was close to 1 minute 30 seconds for most websites. However, this target looked at the total duration of the session, and not the time that the user had your site in the foreground.
For example, a user might click back and forth between your website and another tab several times over the course of 15 minutes, but Universal Analytics would still count the session as being the full 15 minutes (instead of the subset of time that the user spent on your site).
Meanwhile, GA4 would keep track, in milliseconds, of how long the user truly spent browsing the content on your website.
For this reason, it’s not at all uncommon to see average engagement times closer to a minute or less on sites currently running GA4, largely because the new system shows a more accurate representation of how long users spend interacting with your content.
What’s a Good Ratio of New vs. Returning Visitors?
Generally speaking, most AEC firms approach their websites with the goals of driving business development, attracting and retaining top talent, and establishing themselves as thought leaders in their industry.
Importantly, all three of these target audiences (potential business partner, potential recruit, and industry peer looking for information) share the common trait of giving your users a reason to visit your site several times across a period of several weeks or months:
- Potential leads for new business might be looking for firms with the capabilities and experience they need to complete a project and may revisit your site several times looking for more information when weighing their options.
- Potential recruits will regularly check the careers section of your website, follow your blog for thought leadership, or perform research on your leadership team or culture across the various “about” pages of your site, resulting in several sessions over the course of the recruitment process.
- Finally, industry peers or other parties looking for authoritative and reliable expertise will regularly view your website’s thought leadership materials (articles, white papers, videos, etc.) to learn more about the work you do.
For this reason, the ratio of new vs. returning visitors is often a key predictor of higher engagement rates, longer engagement times, and a stronger ability to convert this engaged traffic into leads (or to leverage it toward other overarching business goals).
After analyzing analytics data for our clients, we found an array of returning visitor percentages ranging from around 13% to 24%, with the average across all the firms surveyed sitting at a returning visitor percentage of 17%.
While the reasons a user might return to your site can vary—depending on your content, your firm’s goals, and other factors—it’s still a good idea to maintain a healthy returning visitor ratio of around 15–20%. This helps ensure your site is effectively retaining visitors and encouraging them to come back for future sessions.
Monitor How Your Audience Engages with Your Website
Keeping the pulse of your website’s engagement is a crucial part of any digital marketing or digital recruitment strategy and plays a central role in providing a superior experience to users.
Significant drops in your site’s engagement numbers may indicate a technical problem or other issues, while a slow decay over time in your engagement rate or average engagement time may indicate that your site is nearing the end of its life (or that it’s in dire need of a facelift).
For these reasons, it’s important to regularly monitor these KPIs for your website to ensure your numbers are holding steady or, if possible, trending upward over time.
Similarly, it may be wise to perform a regular audit of your site and its performance to ensure it remains in tip-top shape for as long as possible—increasing your firm’s return on your initial investment and guiding your plans for any potential future website redesigns or iterations. While benchmarking is just the start, the real ROI will come from taking action.
Frequently Asked Questions on What Makes a High-Performing Website?
What is a good engagement rate in GA4 for professional services?
For professional services—including AEC firms—a healthy engagement rate typically falls between 45–55%, depending on factors like traffic source and user intent. Our analysis shows a median engagement rate of 51.86% for AEC websites, while broader industry data puts professional services around 52.97%. Higher engagement rates (in the low 60s) are possible with highly optimized content and user experience.
How do you calculate engagement rate in GA4?
(Engaged Sessions ÷ Total Session) x 100
In GA4, an engaged session is one that meets at least one of the following:
- Lasts longer than 10 seconds
- Includes a conversion event
- Includes at least two pageviews or screen views
What is the average session duration in GA4?
Unlike Universal Analytics, GA4 doesn’t use “average session duration” as a core metric. Instead, it tracks average engagement time, which better reflects active user interaction. For AEC firms, we found the average engagement time to be around 44 seconds, though this varies depending on content type and site structure.
Is bounce rate still used in GA4?
GA4 no longer uses traditional bounce rate. Instead, it introduces “engagement rate” as a more nuanced metric. That said, GA4 does offer a reverse-engineered bounce rate, calculated as: 100% – Engagement Rate
So, if your engagement rate is 50%, your bounce rate would be 50% as well.
What affects engagement time in GA4?
Several factors impact engagement time, including:
- Page speed and mobile usability
- Content depth and clarity
- Placement and quality of CTAs
- User intent (quick contact lookup vs. in-depth research)
Why are AEC websites getting fewer sessions than other industries?
AEC websites typically have longer sales cycles and more niche audiences, which results in fewer—but more qualified—sessions. Visitors often return multiple times before converting, which is why returning visitor percentage and engagement metrics are more telling than traffic volume alone.
"*" indicates required fields
By signing up you are agreeing to our Privacy Policy.